The following is an example of a table generated by SCAN using
Birth Certificate Data .
SCAN users should ask themselves, "What question am I trying to answer?"
or "What am I researching?" Answering these questions will help the user
to determine which variables should be selected during each step of the table creation
process.
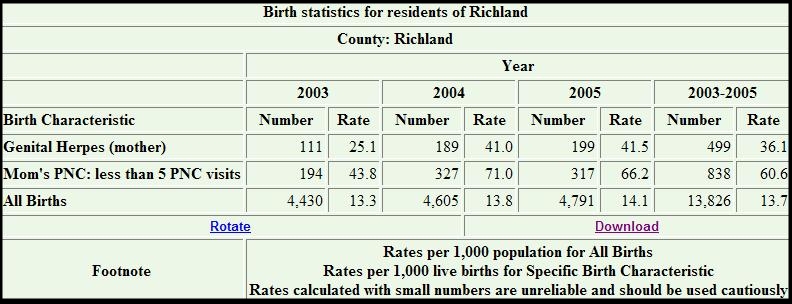
For this example, we were interested in seeing how the Genital Herpes of mothers
and one of the prenatal care indicator: Less than 5 prenatal care visits, changed
in Richland County in the past three years. In order to generate the above table
that answers our research interests, the following step-by-step process was followed
on the "Create a Table" page:
- STEP 1
-
Step One defines the variable whose levels will occupy the rows of the table. Users
can select year, race, age group, marital status, county, or characteristics. For
this example, Birth Characteristic was chosen.
- STEP 2
-
Step Two defines the variable whose levels will occupy the columns of the table.
Users can select year, race, age group, or marital status. For this example, year
was chosen.
- STEP 3
-
Step Three specifies the years of interest. If year is the chosen row or column
variable, the years you select in this step will occupy the rows or columns of your
table. If year is neither a row nor column variable in your table, all years selected
in this step will be summed together and shown in your table. For this example,
we selected three years of our interest.
- STEP 4
-
Step Four is an optional step. In this example, we did not make any specifications
here. If we were interested in seeing this same information for a particular combination
of race, age, and marital status, this is the step where we would define those levels.
- STEP 5
-
Step Five specifies the output level for the table. Users can select Zipcode, County
or DPH region. If zip codes are chosen no rates will be available due to the population
data being limited to counties. For our example, we selected County.
- STEP 6
-
Step Six defines the geographic area to tally for your table. Users can select the
entire state, a single county, or any group of counties. For this example, Richland
County was selected.
- STEP 7
-
Step Seven specifies particular birth characteristics of interest. If characteristics
is chosen as the row variable, then multiple birth characteristics can be selected
here. If characteristics is not the row variable, only one characteristic can be
selected in this step. For this example, we were interested in Genital Herpes
(mother) and Mom's PNC: less than 5 PNC visits, so we
selected them both.
- STEP 8
-
Step Eight specifies the numeric output for the table. Users can select from frequencies
only, frequencies and rates, frequencies and column percents, or frequencies and
row percents. Since we are interested in the frequency and the possible trend in
rates, we selected Frequencies and rates.
- STEP 9
-
If we want to obtain the 95% or 99% confidence interval for the rates, we can make
the selection here. This step is not activated unless user selects Frequencies and
rates in Step 8. In this example, we selected No Confidence Intervals.
- STEP 10
-
If multiple years are selected as the column variable, we can specify different
output presentation formats such as table, trendline and/or barchart. In this example,
we selected Table only.
- SUBMIT REQUEST
-
Submit the request after completing the step-by-step process. An output table will
be promptly returned to the user based upon the specifications. Once the table is
returned, the user can view, print, or download the table. The rotate option on
the table allows the row and column variable to rotate. All specifications from
the step-by-step process are defined in the table's title and labeling. Double-check
this information to make sure you've obtained the information to answer your research
objective.
- INTERPRETATION OF DATA
-
Interpretation of the table is the user's responsibility. Thorough labels
are provided to make interpretation more intuitive. In some situations, footnotes
are provided to help users understand the statistics better.
- WHEN USING THE TABLE
-
Please reference any data extracted from the SCAN system as follows:
Source: Division of Biostatistics, PHSIS, SC DPH.
|