Example
The following is an example of a table, trendline, and
bar chart generated by SCAN using PRAMS Data .
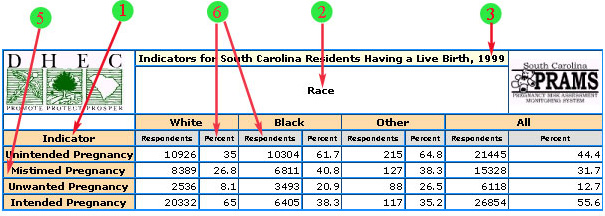 For this example, we were interested in seeing the number of respondents and percentages
of women with unintended, mistimed, unwanted and intended pregnancies for year 1999
by race. In order to generate the above table, the following step-by-step process
was followed on the "Create a Table" page:
For this example, we were interested in seeing the number of respondents and percentages
of women with unintended, mistimed, unwanted and intended pregnancies for year 1999
by race. In order to generate the above table, the following step-by-step process
was followed on the "Create a Table" page:
- STEP 1
-
Step One defines the variable whose levels will occupy the rows of the table. Users
can select Year, Race, Ethnicity, Marital status, Education, Medicaid status, Birth
Weight, Age or Indicator of interest. For this example, Indicator
was chosen.
- STEP 2
-
Step Two defines the variable whose levels will occupy the columns of the table.
Users can select Year, Race, Ethnicity, Marital status, Education, Medicaid status,
Birth Weight, or Age. For this example, Race was chosen.
- STEP 3
-
Step Three specifies the years of interest. If year is the chosen row or column
variable, the years you select in this step will occupy the rows or columns of your
table. If year is neither a row nor column variable in your table, all years selected
in this step will be summed together and shown in your table. For this example,
we selected 1999.
- STEP 4
-
Step Four is an optional step. In this example, we did not make any specifications
here. If we were interested in seeing this same information for a particular combination
of Race, Ethnicity, Age, and Marital status, this is the step where we would define
those variables.
- STEP 5
-
Step Five specifies particular Indicators of interest. If Indicator
is chosen as the row variable, then multiple indicators of interest can be selected
here. The user need to highlight the indicators of interest in the "Available Indicators"
Box and then click the down arrow button so that the selected indicators move to
the "Selected Indicators" Table or hold the control key down when trying to select
multiple indicators. If Indicator is not the row variable, only one characteristic
can be selected in this step. For this example, we were interested in Unintended,
Unwanted, Mistimed, and Intended Pregnancies
so we selected all four of them.
- STEP 6
-
Step 6 allows the user to select their output preference. The options provided are
Respondents and Percents. For this example, both Respondents and
Percents were selected.
- STEP 7
-
Step 7 allows the user to select the output presentation format. The user can select
any of the listed options: Table, Trendline and/or Bar Chart (Table is always generated).Some
options will not be appropriate depending on the variables that users have selected
in the previous steps. For this example Table was selected.
- SUBMIT REQUEST
-
Submit the request after completing the step-by-step process. An output table will
be promptly returned to the user based upon the specifications. Once the table is
returned, the user can view, print, or download the table. The rotate option on
the table allows the row and column variables to rotate. All specifications from
the step-by-step process are defined in the table's title and labeling. Double-check
this information to make sure you've obtained the information to answer your research
objective.
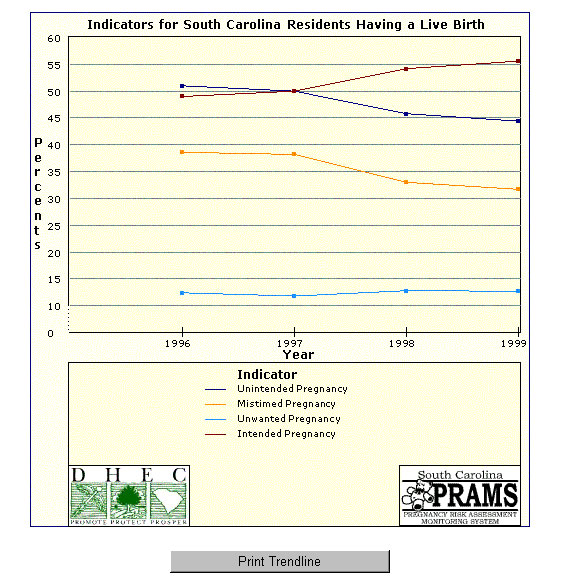
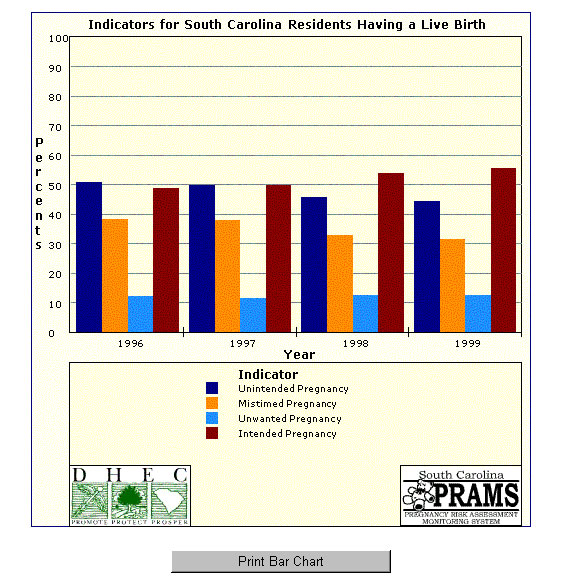
- Trendline and Bar Chart
-
In order to generate a Trendline the user must select Year as a column variable
in step 2, and must also select consecutive years in step 3. Below is an example
of trendline and bar chart. Indicator is still used as a row variable but the column
variable this time was Year and in step 3 we selected four consecutive years:1996,
1997, 1998, and 1999.
- INTERPRETATION OF DATA
-
Interpretation of the table is the user's responsibility. Thorough labels
are provided to make interpretation more intuitive. For this example, of SC residents
delivering a live birth in 1999, 35% of white women had an unintended pregnancy.
|
|