Community Profile Definition Page
- Geographic areas
- Health indicators
- Healthy People 2010 (HP 2010)
- Leading Health Indicator
- Direct age-adjusted rate
- Dynamic notes in the output table
- Dynamic footnote table
- Ranking and ranking quartile
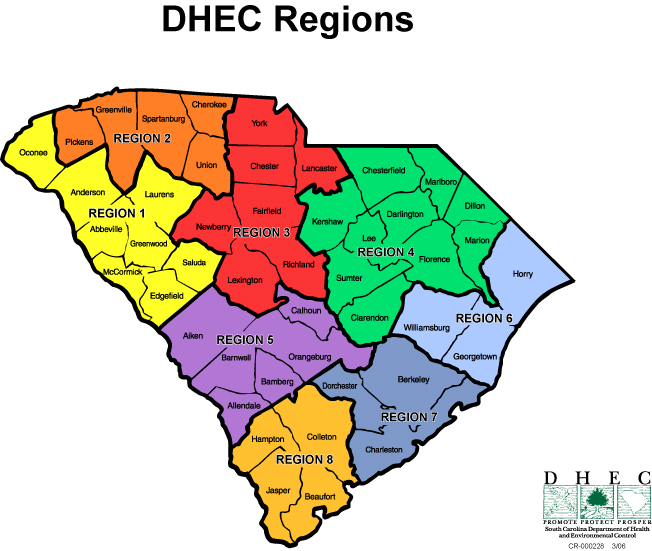
1. Geographic areas
There are 46 counties in the State of South Carolina. They are grouped into 8 DHEC
Regions (regions and counties map)
- Region 1 (Abbeville, Anderson, Edgefield, Greenwood, Laurens, McCormick, Oconee,
and Saluda Counties)
- Region 2 (Cherokee, Greenville, Pickens, Spartanburg, and Union Counties)
- Region 3 (Chester, Fairfield, Lancaster, Lexington, Newberry, Richland and York
Counties)
- Region 4 (Chesterfield, Clarendon, Darlington, Dillon, Florence, Kershaw, Lee, Marion,
Marlboro and Sumter Counties)
- Region 5 (Aiken, Allendale, Bamberg, Barnwell, Calhoun, and Orangeburg Counties)
- Region 6 (Georgetown, Horry, and Williamsburg Counties)
- Region 7 (Berkeley, Charleston, and Dorchester Counties)
- Region 8 (Beaufort, Colleton, Hampton, and Jasper Counties)
The main purpose of the Community Profile module is to assess the different aspects
of the public health issues across the geographic areas in South Carolina such as
counties or DHEC Regions. Rates, confidence interval (CI) and comparison between
the areas are more reliable on region level than on county level.
2. Health indicators
Unlike the other SCAN modules, the Community Profile Module intends to present to
the users with a comprehensive view of the public health issues: such as demographic
characteristics, infant and mother's health, health risk factor, morbidity and mortality.
The indicators included are from different sources. More indicators from broader
aspects of the community health will be added in the future as the data becomes
available.
All the health indicators are grouped into five health categories so they can be
quickly located. Clicking the categories' name below will open up new windows showing
the details of the indicators included in the module so far, such as Healthy People
2010 information, whether an age-adjusted rate can be calculated, data availability
and data source, etc.
3. Healthy People 2010 (HP 2010)
Healthy People 2010 provides our Nation with the wide range of public health opportunities
that exist in the first decade of the 21st century. With 467 objectives in 28 focus
areas, Healthy People 2010 will be a tremendously valuable asset to health planners,
medical practitioners, educators, elected officials, and all of us who work to improve
health. Healthy People 2010 reflects the very best in public health planning—it
is comprehensive, it was created by a broad coalition of experts from many sectors,
it has been designed to measure progress over time, and, most important, it clearly
lays out a series of objectives to bring better health to all people in this country.
Healthy People 2010 presents a comprehensive, nationwide health promotion and disease
prevention agenda. It is designed to serve as a roadmap for improving the health
of all people in the United States during the first decade of the 21st century.
Many of the indicators included in this module are HP 2010 objectives and more objectives
are expected to be added in the future. User can check which indicators are HP 2010
objectives and which focus areas and objectives they belong to in the detailed indicator
table from the "Health indicator" section. HP 2010 target information
is featured in the Community Profile module so that users can look at the trends
or do comparisons in the output tables, trend-lines, bar charts and even in the
interactive maps. For more information about healthy People 2010, please visit the
official site.
4. Leading Health Indicators
The Leading Health Indicators will be used to measure the health of the Nation over
the next 10 years. Each of the 10 Leading Health Indicators has one or more objectives
from Healthy People 2010 associated with it. As a group, the Leading Health Indicators
reflect the major health concerns in the United States at the beginning of the 21st
century. The Leading Health Indicators were selected on the basis of their ability
to motivate action, the availability of data to measure progress, and their importance
as public health issues. For more information about Leading Health Indicators, please
visit the official site.
|
Leading Health Indicator
|
HP2010 objective
|
HP2010 code
|
Availability
|
|
Physical Activity
|
Increase the proportion of adolescents who engage in vigorous physical activity
that promotes cardiorespiratory fitness 3 or more days per week for 20 or more minutes
per occasion.
|
22-7
|
No
|
|
Increase the proportion of adults who engage regularly, preferably daily, in moderate
physical activity for at least 30 minutes per day
|
22-2
|
Yes
|
|
Overweight and Obesity
|
Reduce the proportion of children and adolescents who are overweight or obese
|
19-3c
|
No
|
|
Reduce the proportion of adults who are obese
|
19-2
|
Yes
|
|
Tobacco Use
|
Reduce cigarette smoking by adolescents
|
27-2b
|
No
|
|
Reduce cigarette smoking by adults
|
27-1a
|
Yes
|
|
Substance Abuse
|
Increase the proportion of adolescents not using alcohol or any illicit drugs during
the past 30 days
|
26-10a
|
No
|
|
Reduce the proportion of adults using any illicit drug during the past 30 days
|
26-10c
|
No
|
|
Reduce the proportion of adults engaging in binge drinking of alcoholic beverages
during the past month
|
26-11c
|
Yes
|
|
Responsible Sexual Behavior
|
Increase the proportion of adolescents who abstain from sexual intercourse or use
condoms if currently sexually active
|
25-11
|
No
|
|
Increase the proportion of sexually active persons who use condoms
|
13-6a
|
No
|
|
Mental Health
|
Increase the proportion of adults with recognized depression who receive treatment
|
18-9b
|
No
|
|
Injury and Violence
|
Reduce deaths caused by motor vehicle crashes
|
15-15a
|
Yes
|
|
Reduce homicides
|
15-32
|
Yes
|
|
Environmental Quality
|
Reduce the proportion of persons exposed to air that does not meet the U.S. Environmental
Protection Agency’s health-based standards for ozone.
|
8-1a
|
No
|
|
Reduce the proportion of nonsmokers exposed to environmental tobacco smoke
|
27-10
|
No
|
|
Immunization
|
Increase the proportion of young children who receive all vaccines that have been
recommended for universal administration for at least 5 years
|
14-24a
|
No
|
|
Increase the proportion of noninstitutionalized adults who are vaccinated annually
against influenza and ever vaccinated against pneumococcal disease
|
14-29a,b
|
Yes
|
|
Access to Health Care
|
Increase the proportion of persons with health insurance
|
1-1
|
Yes
|
|
Increase the proportion of persons who have a specific source of ongoing care
|
1-4a
|
Yes
|
|
Increase the proportion of pregnant women who begin prenatal care in the first trimester
of pregnancy
|
16-6a
|
Yes
|
5. Direct age-adjusted rates
Age adjustment, using the direct method, is the application of observed age-specific
rates to a standard age distribution to eliminate differences in crude rates in
populations of interest that result from differences in the populations’ age
distributions. Age adjustment is particularly relevant when populations being compared
have different age structures. Age-adjusted rates should be viewed as relative
indexes rather than actual measures of risk.
Age-adjusted rates are calculated by the direct method as follows:
In the Community Profile module, whenever applicable, direct age-adjustment is based
on the year 2000 U.S. population, which is used to generate age-adjusted baseline
data for many Healthy People 2010 objectives.
6. Dynamic notes in the output table
|
Dynamic note
|
Full notation
|
Condition of activation and explanation
|
|
AAR
|
Age Adjusted Rate only
|
Whenever applicable, the Healthy People 2010 targets are calculated in terms of
age-adjusted rate. This dynamic note is shown to prevent an invalid comparison between
a crude rate and an age-adjusted rate. User has to go back to the "Table/Map" input
page and select "Age-adjusted Rates" in step six for the indicator(s) that have
HP 2010 targets in age-adjusted rate.
|
|
CR
|
Crude Rate only
|
When the age-adjusted rate in Step six is selected but one or more of the selected
indicators have crude rate. In order to show the crude rate or any statistics related
to the crude rate such as confidence interval or ranking, user need to go back to
the "Table/Map" input page and select "Crude Rates" in step six.
|
|
DSU
|
Data Statistically Unreliable
|
When the frequency or unweighted frequency (survey: BRFSS) of an event is less than
15, or the unweighted underlying population (survey: BRFSS) is less than 50, any
output statistics that relate to the rate is masked with this dynamic note. The
frequency is still shown in the output table.
|
|
NA
|
Not Available
|
Information is not applicable or not available.
|
|
NSD
|
Not Significantly Different
|
The rate of the selected area is not significantly different from the same rate
of the state average based on an alpha level of 0.05
|
|
RD
|
Regional level Data only
|
One of more of the selected indicators don't have county level data. If this is
the case, users need to go back to the "Table/Map" input page and select "Regions"
in Step One.
|
|
SAR
|
Single Age/Race group only
|
For some of the survey indicators, 95% CI/age-adjusted rate cannot be calculated
if more than one age groups/race groups are selected in the input page.
|
|
SH
|
Significantly Higher than the state average
|
The rate of the selected area is significantly higher than the same rate of the
state average based on an alpha level of 0.05
|
|
SL
|
Significantly Lower than the state average
|
The rate of the selected area is significantly lower than the same rate of the state
average based on an alpha level of 0.05
|
|
SY
|
Survey data indicator is available for Single Year only
|
Statistics for some of the survey indicators cannot be calculated based on the combined
years. User has to select single year or year as the row variable in Step Two.
|
7. Dynamic footnote table
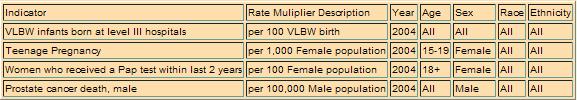
One characteristics of the Community Profile Module is that the data come from different
sources and the indicators are different in my aspects. In order to overcome the
difficulty in combining these statistics, while still providing multiple indicators
on the same output page, this module is designed to retrieve database information
based on the user's selections and characteristics of the indicators.
For example, a user can select the above four indicators together and select year
2004 and all age, sex, race and ethnicity. The application retrieves the correct
multiplier and denominator for rate calculate for each indicator and displays them
in the footnote table. Business logic and rules are built into SCAN based on the
underlying data constraints so the application understand that if the user is looking
for "Teenage Pregnancy" statistics then the data only applies to female
of ages 15 to 19, and for "Women who received a Pap test within last 2 year"
the data only applies to female over 18 years old. User can also select different
demographic levels of their interest, which will be joined together at the valid
level for the indicator, and the intersection will be shown in the footnote table.
By doing this, user can clear understand which group of people the statistics is
based upon and how the rates are calculated.
8. Ranking and ranking quartile
The rankings/ranking quartiles are based on the crude/age-adjusted rate across all
the counties/DHEC Regions. The highest rate has the highest rank and the lowest
rate has the lowest rank. When the user selects the DHEC Region geographic unit,
the result is the ranking of the rate for the eight regions. When user selects the
county geographic unit, the rate is first ordered from 1 to 46 for all 46 counties
and then put into four quartiles: rank 1 to 11 in the 1st quartile, rank 2 to 23
in the 2nd quartile, rank 24 to 34 in the 3rd quartile and rank 35 to 46 in the
4th quartile. The reason this is done for county level is that the statistic at
the county level has much larger variability than the same statistics at the region
level. At the county level, the actual ranking may have very large variability but
becomes much more stable when grouped into ranking quartiles.
Demographics
|
Population
|
HP 2010
|
Age-adjust
|
Data availability
|
Source
|
|
No
|
No
|
County level, 1999 - 2004
|
Census
|
|
|
Natality
|
Birth (birth rate)
|
HP 2010
|
Age-adjust
|
Data availability
|
Source
|
|
No
|
No
|
County level, 1999 - 2004
|
Vital Record
|
|
|
|
Birth (fertility rate)
|
HP 2010
|
Age-adjust
|
Data availability
|
Source
|
|
No
|
No
|
County level, 1999 - 2004
|
Vital Record
|
|
|
|
Low Birth Weight (LBW)
|
HP 2010
|
Age-adjust
|
Data availability
|
Source
|
|
16-10a
|
No
|
County level, 1999 - 2004
|
Vital Record
|
|
LBW defined as birth weight less than 2500g (5.51 lbs)
|
|
Very Low Birth Weight (VLBW)
|
HP 2010
|
Age-adjust
|
Data availability
|
Source
|
|
16-10b
|
No
|
County level, 1999 - 2004
|
Vital Record
|
|
VLBW defined as birth weight less than 1500g (3.31 lbs)
|
|
Preterm Birth
|
HP 2010
|
Age-adjust
|
Data availability
|
Source
|
|
16-11a
|
No
|
County level, 1999 - 2004
|
Vital Record
|
|
|
|
Mothers without high school degree
|
HP 2010
|
Age-adjust
|
Data availability
|
Source
|
|
No
|
No
|
County level, 1999 - 2004
|
Vital Record
|
|
|
|
Mothers who smoke during pregnancy
|
HP 2010
|
Age-adjust
|
Data availability
|
Source
|
|
No
|
No
|
County level, 1999 - 2004
|
Vital Record
|
|
This includes any smoking in the first, second and third trimester
|
|
Mothers who are unmarried (no PAT/ACK)
|
HP 2010
|
Age-adjust
|
Data availability
|
Source
|
|
No
|
No
|
County level, 1999 - 2004
|
Vital Record
|
|
Mothers with Paternal Acknowledgement are grouped with "married" for statistical
purpose
|
|
Mothers with Prenatal Care Begin in the first trimester
|
HP 2010
|
Age-adjust
|
Data availability
|
Source
|
|
16-6a
|
No
|
County level, 1999 - 2004
|
Vital Record
|
|
First trimester includes the first, second and third month of pregnancy.
|
|
Mothers with adequate prenatal care
|
HP 2010
|
Age-adjust
|
Data availability
|
Source
|
|
16-6b
|
No
|
County level, 1999 - 2004
|
Vital Record
|
|
Adequate prenatal care is based on the Kotelchuck Index
|
|
VLBW infants born at level III hospitals
|
HP 2010
|
Age-adjust
|
Data availability
|
Source
|
|
16-8
|
No
|
County level, 1999 - 2004
|
Vital Record
|
|
|
|
Birth paid by Medicaid
|
HP 2010
|
Age-adjust
|
Data availability
|
Source
|
|
No
|
No
|
County level, 1999 - 2004
|
Vital Record
|
|
|
Health Risk Factor
|
Health insurance, age 18-65
|
HP 2010
|
Age-adjust
|
Data availability
|
Source
|
|
1-1
|
Yes
|
Region level, 1999 - 2004
|
BRFSS
|
|
|
|
Teenage pregnancy, age 15-19
|
HP 2010
|
Age-adjust
|
Data availability
|
Source
|
|
9-7
|
No
|
County level, 1999 - 2004
|
Vital Record
|
|
|
|
Binge drinking of alcoholic beverages, age 18+
|
HP 2010
|
Age-adjust
|
Data availability
|
Source
|
|
26-11c
|
No
|
Region level, 1999, 2001 - 2004
|
BRFSS
|
|
|
|
Cigarette smoking, age 18+
|
HP 2010
|
Age-adjust
|
Data availability
|
Source
|
|
27-1a
|
Yes
|
Region level, 1999 - 2004
|
BRFSS
|
|
|
|
Adults who are obese, age 20+
|
HP 2010
|
Age-adjust
|
Data availability
|
Source
|
|
19-2
|
Yes
|
Region level, 1999 - 2004
|
BRFSS
|
|
Overweight corresponds to 25<=BMI<30 and Obese corresponds to BMI>=30
|
|
Persons who have a specific source of onging care, age 18+
|
HP 2010
|
Age-adjust
|
Data availability
|
Source
|
|
1-4a
|
Yes
|
Region level, 2001 - 2004
|
BRFSS
|
|
|
|
Women who received a mammogram within past 2 years, age 40+
|
HP 2010
|
Age-adjust
|
Data availability
|
Source
|
|
3-13
|
Yes
|
Region level, 1999, 2000, 2002, 2004
|
BRFSS
|
|
|
|
Blood cholesterol checked in past 5 years, 18+
|
HP 2010
|
Age-adjust
|
Data availability
|
Source
|
|
12-15
|
Yes
|
Region level, 1999, 2001 - 2003
|
BRFSS
|
|
|
|
Women who ever received a Pap test, age 18+
|
HP 2010
|
Age-adjust
|
Data availability
|
Source
|
|
3-11a
|
Yes
|
Region level, 1999, 2000, 2002, 2004
|
BRFSS
|
|
|
|
Women who received a Pap test within last 2 years, age 18+
|
HP 2010
|
Age-adjust
|
Data availability
|
Source
|
|
3-11b
|
Yes
|
Region level, 1999, 2000, 2002, 2004
|
BRFSS
|
|
|
|
Fecal occult blood test within last 2 years, age 50+
|
HP 2010
|
Age-adjust
|
Data availability
|
Source
|
|
3-12a
|
Yes
|
Region level, 1999, 2001 - 2004
|
BRFSS
|
|
|
|
Regular moderate physical activity, 3+ days/week for 30 or more
minutes, age 18+
|
HP 2010
|
Age-adjust
|
Data availability
|
Source
|
|
22-2
|
Yes
|
Region level, 2001 - 2004
|
BRFSS
|
|
|
|
Influenza vaccination within the past year, age 65+
|
HP 2010
|
Age-adjust
|
Data availability
|
Source
|
|
14-29a
|
Yes
|
Region level, 1999 - 2004
|
BRFSS
|
|
|
|
Pneumococcal Pneumonia Vaccination, ever had, age 65+
|
HP 2010
|
Age-adjust
|
Data availability
|
Source
|
|
14-29b
|
Yes
|
Region level, 2001 - 2004
|
BRFSS
|
|
|
Morbidity
|
Diabetes that is clinically diagnosed, age 18+
|
HP 2010
|
Age-adjust
|
Data availability
|
Source
|
|
5-3
|
Yes
|
Region level, 1999 - 2004
|
BRFSS
|
|
|
|
Limitation in activity due to Arthritis: adults with Chronic Joint
Symptoms, age 18+
|
HP 2010
|
Age-adjust
|
Data availability
|
Source
|
|
No
|
No
|
County level, 1999 - 2004
|
BRFSS
|
|
|
Mortality
|
Infant death with birth weight less than 2500g
|
HP 2010
|
Age-adjust
|
Data availability
|
Source
|
|
No
|
No
|
County level, 1999 - 2004
|
Vital Record
|
|
|
|
Infant death with birth weight less than 1500g
|
HP 2010
|
Age-adjust
|
Data availability
|
Source
|
|
No
|
No
|
County level, 1999 - 2004
|
Vital Record
|
|
|
|
Infant death
|
HP 2010
|
Age-adjust
|
Data availability
|
Source
|
|
16-1c
|
No
|
County level, 1999 - 2004
|
Vital Record
|
|
Infant death: death within 1 year
|
|
Neonatal death
|
HP 2010
|
Age-adjust
|
Data availability
|
Source
|
|
16-1d
|
No
|
County level, 1999 - 2004
|
Vital Record
|
|
Neonatal death: death within the first 28 days of life
|
|
Postneonatal death
|
HP 2010
|
Age-adjust
|
Data availability
|
Source
|
|
16-1e
|
No
|
County level, 1999 - 2004
|
Vital Record
|
|
Postneonatal death: death between 28 days and 1 year
|
|
Coronary heart disease death
|
HP 2010
|
Age-adjust
|
Data availability
|
Source
|
|
12-1
|
Yes
|
County level, 1999 - 2004
|
Vital Record
|
|
ICD-10: I20-I25
|
|
Stroke death
|
HP 2010
|
Age-adjust
|
Data availability
|
Source
|
|
12-7
|
Yes
|
County level, 1999 - 2004
|
Vital Record
|
|
ICD-10: I60 - I69
|
|
Suicide death
|
HP 2010
|
Age-adjust
|
Data availability
|
Source
|
|
No
|
Yes
|
County level, 1999 - 2004
|
Vital Record
|
|
ICD-10: X60-X85, Y87.0
|
|
Homicide death
|
HP 2010
|
Age-adjust
|
Data availability
|
Source
|
|
15-32
|
Yes
|
County level, 1999 - 2004
|
Vital Record
|
|
ICD-10: X85-Y10, Y87.1
|
|
Motor vehicle crashes death
|
HP 2010
|
Age-adjust
|
Data availability
|
Source
|
|
15-15a
|
Yes
|
County level, 1999 - 2004
|
Vital Record
|
|
ICD-10: V02-V04,V09.0, V09.2,V12-V14,V19.0-V19.2,V19.4-V19.6,V20-V79,V80.3-V80.5,V81.0-V81.1,V82.0-V82.1,V83-V86,V87.0-V87.8,V88.0-V88.8,V89.0,V89.2
|
|
Unintentional injury death
|
HP 2010
|
Age-adjust
|
Data availability
|
Source
|
|
15-13
|
Yes
|
County level, 1999 - 2004
|
Vital Record
|
|
ICD-10: V01-X59, Y85-Y86
|
|
Cancer death
|
HP 2010
|
Age-adjust
|
Data availability
|
Source
|
|
3-1
|
Yes
|
County level, 1999 - 2004
|
Vital Record
|
|
ICD-10: C00-C97
|
|
Breast cancer death, female
|
HP 2010
|
Age-adjust
|
Data availability
|
Source
|
|
3-3
|
Yes
|
County level, 1999 - 2004
|
Vital Record
|
|
|
|
Colorectal cancer death
|
HP 2010
|
Age-adjust
|
Data availability
|
Source
|
|
3-5
|
Yes
|
County level, 1999 - 2004
|
Vital Record
|
|
|
|
Lung cancer death
|
HP 2010
|
Age-adjust
|
Data availability
|
Source
|
|
3-2
|
Yes
|
County level, 1999 - 2004
|
Vital Record
|
|
|
|
Prostate cancer death, male
|
HP 2010
|
Age-adjust
|
Data availability
|
Source
|
|
3-7
|
Yes
|
County level, 1999 - 2004
|
Vital Record
|
|
|
|
Year of Potential Life Lost (YPLL) before age 75: All cause
|
HP 2010
|
Age-adjust
|
Data availability
|
Source
|
|
No
|
No
|
County level, 1999 - 2004
|
Vital Record
|
|
|
|
Year of Potential Life Lost (YPLL) before age 75: motor vehicle
crashes
|
HP 2010
|
Age-adjust
|
Data availability
|
Source
|
|
12-1
|
Yes
|
County level, 1999 - 2004
|
Vital Record
|
|
ICD-10: I20-I25
|